Twitter analytics made easy
Find all the Twitter analytics and insights you need to compare against your social, search and web performance in one powerful platform.
- 30 days performance insights in under a minute
- Start exploring immediately
- Book a demo or join our events
Global brands that trust Digivizer
All your Twitter analytics in one platform
- Measure Twitter organic and paid post-performance over time and by any period for in-depth analysis
- Understand where Twitter dominates and falls short in your marketing strategy
- Compare cross-channel all your social, search, web, organic, earned and paid media analytics by metric comparisons on volume of posts, impressions, engagements, clicks, followers, video views, shares, comments and likes across all your channels
By using Digivizer to test, measure and refine content, the business harnesses every opportunity to engage more customers online and in-store. Social and search data lets them better understand customer needs and respond accordingly. Plus it grows my business.
Robyn McLennan, Founder of Easy Living Footwear
Integrations
Google Analytics
Google Ads
Google Analytics 4
Google Search Console
YouTube
Amazon Ads
TikTok
Microsoft Ads
Build an effective social media marketing strategy for Twitter
- Identify your top social media content and how it compares to other sources like email, referrals, and paid media platforms so you can market where it counts
- Discover search term opportunities for your organic content and paid ads on Twitter
- Identify your top posters and to posts based on engagement
There are many providers of social data in the market but we believe that Digivizer’s unique intellectual property sets it apart and helps us create differentiated propositions for our clients, capturing the real-time value of social data in a structured and efficient way.
Frank Farrall, National Leader of Deloitte Digital
Optimize your Twitter advertising spend
- Easily track your brand mentions and hashtags to connect with new community members and potential customers
- Monitor ROAS, conversions and paid media budgets along with all other metrics
- Identify which Twitter paid creative drives results – compare performance across Facebook, YouTube, Google, LinkedIn, Twitter, TikTok, Amazon Ads and Microsoft Ads
I love that I can see exactly what potential buyers are searching for and what is driving my engagements, conversions and costs.
John Ullo, Founder & CEO, Elvie Jewelry
Jam packed with valuable insights
- Share transparent and real-time digital marketing results and insights easily across all your stakeholders.
- Play to win in search – see how you rank in Google and what makes people click with deep search engine marketing analytics.
- Digivizer Express sends you and your team weekly and monthly reports to get started!
- Pricing & plans that are built to scale. Free 30 day trial. Monthly payments. No contract. Upgrade as you grow or cancel anytime.
- Share the digital marketing analytics dream – inviting anyone into your Brand Space to build trust, be transparent and bring digital marketing governance.
Why our customers love Digivizer
“Great platform, very easy enough to navigate. Love that everything is in the one spot for tracking performance! Oh and all the help has been 5 star.”
It's easy to get started.
Connect your digital marketing channels to your Brand Space.
Invite your team and stakeholders to your Brand Space.
Analyze cross-channel data to create real insights.
Create digital marketing reports in a couple of clicks.
Build a historical data archive for deeper insights and smarter marketing.
Get insights straight to your inbox with automated weekly reports.
Choose the plan that suits you, your team, agency or enterprise.
All of our plans include 30 days of historical data downloaded in under a minute. You can start with Digivizer Free Plan or if you are collaborating or want to share with others, select any paid plan that offers a 30 day free trial period. Upgrade as you grow or cancel anytime as plans work on a month by month basis with no lock in period.
Billing: Save 15% with yearly plans
Monthly
Yearly
Digivizer
Free
Ideal for anyone wanting to understand the value of digital marketing insights.
-
1 User
-
1 Brand Space
-
1 Hashtag
-
4 Social, paid or web accounts
-
Cross-channel analytics
-
Web performance insights
-
Social media mentions
-
Weekly and monthly reports
-
Chat support
-
Help Center docs and videos
Digivizer
For Teams
Ideal for growing teams focused on building more together.
-
6 Users
-
1 Brand Space
-
1 Hashtag
-
20 Social, paid or web accounts
-
Cross-channel analytics
-
Web performance insights
-
Social media mentions
-
Weekly and monthly reports
-
Chat support
-
Help Center docs and videos
-
Additional reporting options
Digivizer
For Brands
Ideal for companies wanting to maintain brand health and create strategies for growth.
-
Unlimited users
-
1 Brand Space
-
10 Hashtags per Brand Space
-
20 Social, paid or web accounts
-
Cross-channel analytics
-
Web performance insights
-
Social media mentions
-
Weekly and monthly reports
-
Chat support
-
Help Center docs and videos
-
Additional reporting options
-
Track up to 6 Influencers
-
Quarterly insights sessions
Digivizer
For Agencies
Ideal for Agencies wanting to access all digital marketing analytics in one platform and impress your clients.
-
Unlimited users
-
8 Brand Spaces
-
12 Hashtags per Brand Space
-
50 Social, paid or web accounts
-
Cross-channel analytics
-
Web performance insights
-
Social media mentions
-
Weekly and monthly reports
-
Chat support
-
Help Center docs and videos
-
Additional reporting options
-
Track up to 50 Influencers
-
Quarterly insights sessions
Digivizer
Free
Ideal for anyone wanting to understand the value of digital marketing insights.
-
1 User
-
1 Brand Space
-
1 Hashtag
-
4 Social, paid or web accounts
-
Cross-channel analytics
-
Web performance insights
-
Social media mentions
-
Weekly and monthly reports
-
Chat support
-
Help Center docs and videos
Digivizer
For Teams
Ideal for growing teams focused on building more together.
-
6 Users
-
1 Brand Space
-
1 Hashtag
-
20 Social, paid or web accounts
-
Cross-channel analytics
-
Web performance insights
-
Social media mentions
-
Weekly and monthly reports
-
Chat support
-
Help Center docs and videos
-
Additional reporting options
Digivizer
For Brands
Ideal for companies wanting to maintain brand health and create strategies for growth.
-
Unlimited users
-
1 Brand Space
-
10 Hashtags per Brand Space
-
20 Social, paid or web accounts
-
Cross-channel analytics
-
Web performance insights
-
Social media mentions
-
Weekly and monthly reports
-
Chat support
-
Help Center docs and videos
-
Additional reporting options
-
Track up to 6 Influencers
-
Quarterly insights sessions
Digivizer
For Agencies
Ideal for Agencies wanting to access all digital marketing analytics in one platform and impress your clients.
-
Unlimited users
-
8 Brand Spaces
-
12 Hashtags per Brand Space
-
50 Social, paid or web accounts
-
Cross-channel analytics
-
Web performance insights
-
Social media mentions
-
Weekly and monthly reports
-
Chat support
-
Help Center docs and videos
-
Additional reporting options
-
Track up to 50 Influencers
-
Quarterly insights sessions
Need to know more? Explore some helpful information here:
Register for one our 30-minute discovery webinars for an introduction to Digivizer. Learn how you can save time & money by accessing all your digital marketing analytics in one platform.
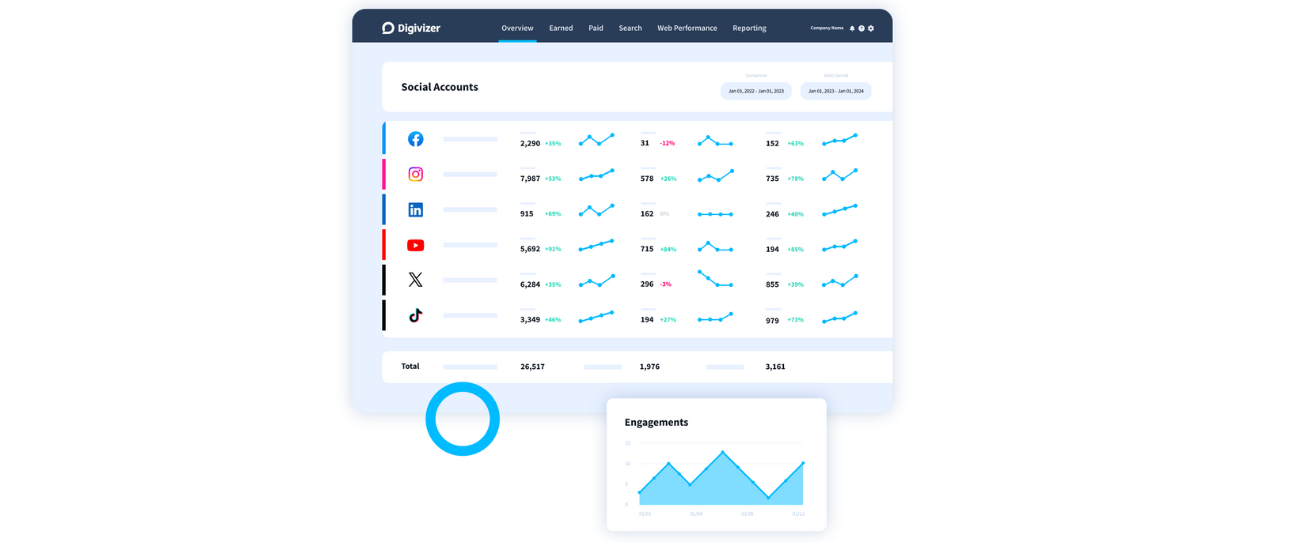
You can get a top-level look at your social media content performance on our Overview. Here you can at a glance start to analyze what is working and what isn’t across organic, earned, paid and web. Then choose where you wish to dig in deeper.
Social Accounts
The overview page provides an apples-for-apples comparison for your followers, engagements, and video views. As soon as you click through to each platform you will see even richer social media analytics like: Impressions, Reach, Engagement, Click-throughs, Engagement Rates, Comments and you can sort the actual post content to see which creative and messaging is resonating and driving the outcome you are looking for. YouTube provides additional metrics and the ability to sort your content by Average Video Percentage Viewed, Average View Duration, Total Minutes Viewed and more.
Earned Media & Hashtags by Engagement
You can see the best performing (ranked by number of engagements) mentions of your social media accounts or your chosen hashtag on Twitter and Instagram. In terms of analyzing your social media performance, this section is key for highlighting who among your fans and followers is sharing the best content that is talking about you.
Paid Media
This shows best performing paid media, with apples-for-apples comparative analytics, allowing you to compare the best performing platform by objective, campaign by objective, adset or ad by objective. You can also click to see the best performing creative ad (or worst), to easily identify what to do more of, put more budget behind and what to stop doing. Sort by what drives most impressions, clicks, engagements, conversions, conversion value or what is delivering greatest Return on Advertising Spend (ROAS). This helps with media planning and gaining more for your paid media investment. Connect your Facebook, Instagram, Google, Linkedin, Twitter, Amazon Advertising, Tiktok Business and Microsoft Ad accounts.
Web Performance
See all your most important web performance analytics including your traffic volume, traffic source, search rankings, top pages, revenue, transactions, number of users including number of new users, and other key web performance health metrics. See how organic or paid social is contributing to driving web traffic and delivering conversions and sales, e relative to other sources.
When you first connect your account, including in trial, you will immediately see 30 days of data across your organic, paid and web accounts. Earned Media starts gathering from the time you connect and choose your hashtag to be monitored. Whilst your Digivizer plan is paid up, all your insights will continue to build over time. You can then:
Choose any period you want to measure period on period performance
You can adjust the time period in the date picker in the top right of the Overview Screen and the individual Social Account pages. By default, the date range is set to one week, but you can set it to whichever date range you want to see. You can view the performance of content posted in the last month, or any period of time you have had your account connected (NB: you can only see data from up to 30 days before you connected your accounts to the Digivizer platform for social, search and web, and from the date you select your hashtag to be tracked).
Percentages & period-on-period performance
Everything will measure the exact number of days you currently have selected period on period. If you received more engagements this week than last week, for example, the percentage will be colored green and have an up arrow next to it (eg. 42% more engagements than last week). If you receive fewer engagements, it will be colored red and have a down arrow next to it (eg. 42% fewer engagements than last week).
Digivizer supports a wide variety of major social and search platforms.
As of June 2022, you can connect:
Social Accounts
YouTube
Business Accounts
Facebook Pages
Business/Paid Ad Accounts
Tiktok
YouTube
Microsoft
Amazon Ads
Web performance
Google Universal Analytics
GA4 analytics
We are always working on keeping up to date so if you are keen for another social media platform to be integrated with Digivizer, let us know your suggestion by messaging via the Intercom chat in the bottom right of the Digivizer screen. We can support any platform that allows Google Analytics implementations.
Digivizer was built with sharing in mind! You can invite anyone into your brand space to build trust, be transparent and bring digital marketing governance – they will see what you see and can filter reports to look at insights by any period.
Making reporting and insights a live experience means that you can be confident that everybody is on the same page, and nobody is relying on outdated information.
Digivizer Express is a weekly insights report which provides you with at a glance results across owned, earned, paid and web media and is delivered to you and your team every Monday via email so you will be ready to start your week!
We’ve identified 5 things you should measure that will give you a better understanding of the performance of your digital marketing creative assets – and of the return on the time and resources you invest:
- Organic content: Determine which content works for you in organic media – what gains best impressions, reach, engagement, click-throughs. Often, the content that works well in organic gives you a real measure for what your audience likes and performs well in paid.
- Earned content: Determine who gains the most engagement from their own content when they speak about you or a hashtag you follow (or if they are acting as a paid influencer). Remember: the ultimate aim is right person, right content, right timing, right channel, right offer. You need to know what works with your audience, and have a multi-channel view.
- Themes and topics: Determine the patterns around the nature of the content that gains best performance – the creative, copy, call-to-action and what leads to total conversions.
- Content types: Ensure your performance insights include visual content (not just numbers) – you need to see what story sells and what the different types of content are that work at different stages of your funnel and against different objectives. You can easily see in organic and paid media what content types are working best for you.
- Compare and benchmark: Ensure you have one analytics platform that covers every channel – in both search and social and across organic, earned and paid media. It is important to compare and benchmark the performance of content across different digital channels including paid media.
Digivizer makes it easy to gain a quick understanding of your ROI and comparative performance across all your digital channels.
This is our area of expertise and we love to share our tips & tricks. Our experts have produced a guide that gives you the tools you need to learn how to leverage data and digital marketing analytics insights to create paid social media and search ads that work on every platform. The guide covers:
- How to build a digital sales funnel
- Paid media ad examples
- Successful social media campaigns
- Paid media advertising costs
- How to use carousel ads
- Templates and much more
This resource is perfect for businesses, social media marketers and paid digital strategists who want to calculate the ROI of campaigns and use data-driven insights to prove the value of your strategy. Discover how to boost your Paid Social Media and Paid Search Media campaigns by creating the best possible paid media campaigns for your business.
Know for sure what content is driving conversions and growing your web traffic – where it’s coming from and what’s converting your search terms into sales. In Digivizer you can identify:
- Best performing content on your social channels sorted by key metrics like impressions, video views, engagement, click-throughs, etc for any time period.
- Who posts about your brand, products or services in social and digital channels and which content is driving the highest engagement.
- How every dollar you are investing is working for you.
To learn more, watch our explainer video.
Grow your share of voice with a digital marketing analytics tool that tracks brand-relevant conversations and industry competitors. With Digivizer you can find out what people say about your business online. Set up social listening to monitor what is being said about your company, brand, products or campaigns on social media channels.
- Add filters to focus the listening data you see by platform, hashtag or brand mention.
- Sort organic and paid posts by engagement rate or by flexible date range.
- Access influencer data for deeper insights and greater collaboration with your ambassadors.
Respond fast, every time, to build more meaningful relationships with customers and keep an ear to the ground with cross-channel mentions monitoring of your brand and competitor brands. Engage with the customers and top influencers talking about your brand to easily build successful relationships.
Digivizer gives you everything you need to make influencer marketing magic happen. From finding the best brand advocates to tracking their performance, sharing insights and building trust. All your critical metrics and essential tools are here.
You can easily sort through thousands of active, engaging influencers and thought leaders with one click. Identify quality ambassadors for your brand, based on post impact or post frequency, and alignment with your audiences’ interests, to harness the most powerful voices.
Get a complete view of your paid social and paid search analytics by platform, campaign, adset, right down to individual ads in a single view. See like-for-like comparisons of what drives best cost-per-outcome to identify where to spend to get greater ROI.
With Digivizer you can use the datepicker to quickly select a date range and then use the filter option on any of the reports to focus on specific metrics including:
- Paid spend on engagement to CPM, CPE, Link Clicks, CTR, CPC and conversion rates
- Spend vs conversion rate across campaign, adset or advert to optimize faster and avoid wasting budget.
- Paid social and search performance metrics across all your favorite channels
ROAS is not just another one of those marketing acronyms you’ll never use. “Return on Ad Spend” – ROAS – is super important for businesses engaging in digital advertising, such as ecommerce businesses. It helps you understand your profit margin in relation to your advertising efforts.
For digital marketers and business owners who need to keep track of every dollar spent on their online advertising and marketing campaigns, ROAS is very handy. It’s basically a shortcut to knowing if you’re making or losing money on your ads.
Sometimes it’s hard to know which channels are the best use of your marketing efforts. By keeping track of your ROAS metrics across multiple channels like social media and Google, you can know in real-time where your ads are reaching your customers and encouraging them to take action. Then you can focus on fixing areas that need improvement, and doubling down on your successes.
In the Digivizer platform, you can see the ROAS of every stage of your advertising campaigns on Facebook, Instagram and Google, right down to the campaign, adset and advert levels. That way you know exactly which ads are delivering results in relation to the budget spent.
By using insights drawn from the platform, one of our current customers went from negative ROAS to 12 in under 12 months.
Watch our helpful explainer video to understand how social and paid media help turn search terms into sales.
With Digivizer you get total visibility over:
- High and low ranking terms to fine-tune your SEO strategy paid keywords. Find the search terms actively driving to your site and monitor their impact, from click to CTR and position.
- Web conversions and ROI with a high level view of trends in revenue, transactions and goal completions. Make detailed comparisons quickly and share with a click.
- Rich insights into your website’s most (and least) viewed pages to understand what content keeps audiences hooked, and where quality traffic exists, so you can optimize from strategy to sales.
You can also use top pages insights to know which pages are working and how to improve web performance and drive quality web traffic to your site or eCommerce store. Web analytics rank each of your web pages based on the average session time, page views, bounce rate, and exit percentage.
With Digivizer’s feature Top Pages, you can understand which pages of your website perform best on web traffic metrics with Digivizer.
What is Top Pages?
In Top Pages, you’ll be able to easily identify which pages of your website perform best on web traffic metrics through a ranking of each of your web pages, the average session time, page views, bounce rate and exit percentage. Users spend on average only 62 seconds viewing a website – that means even if you’re gaining traffic, you still have the challenge of making sure every page of your website is optimized to engage a visitor for as long as possible in order to convert them.
What does Top Pages tell me?
By understanding the pages that are best performing for web traffic, you can easily identify what content, layout, and products resonate with your customers, draw the most traffic, keep visitors engaged and encourage them to further explore your site. Each column highlights a different feature; Page Views (how many people are visiting), Avg. Time on Page (are they staying for long/engagement with content), Bounce Rate (the percentage of single-page sessions in which no interaction was made) and Exit Rate (how often people exit from that page when they visit).
How can I use Top Pages?
As well as identifying your best content, you can measure goals by clicking on any of the metrics outlined above to filter results. You can find the overall average of your page performance in the bottom darker gray bar.
Not sure about what particular terms mean? We’ve built a glossary for you to look up definitions of terms you might see in the app.
Brand Space: your centralized view of all your connected digital accounts that influence discussions of your brand. Users generally choose a brand name and connect all the social, search, paid, and web accounts for that space to make it easy to understand and assess overall brand performance.
Impressions: measures the number of times a post is seen by your audience. It is the volume of unique audience members that see a post (reach) multiplied by the average number of times the audience sees a post (frequency).
Engagement: measures the interaction between content and followers. It comprises likes, reactions, shares, comments and clicks. Video views are reported separately and are not included as engagements.
Engagement Rate: measures the proportion of your audience who see a post and interact with it against those who see the post and do not. It is calculated as engagements divided by impressions.
Followers: is the number of unique users on social platforms who have subscribed to your channel. These are the users who see organic posts.
Clicks and Click-throughs: measures the actions of users engaging with a post that links to other destinations, or expansions of the post. Often specific urls are set-up as part of a social post that users click through to.
Click-through Rate (CTR): measures the proportion of the audience who see a post and interact with it against those who see a post and do not. It is calculated as clicks and click-throughs divided by impressions.
Conversions: measures the volume of the audience who conduct a certain action after interacting with social media posts. It often refers to converting the audience to provide additional information or purchase a product.
Conversion Rate: measures the proportion of the audience who click on a social post and complete a goal. It is calculated as conversions divided by clicks.
Cost per Impression (CPM): measures the efficiency of paid posts in reaching the target audience. It is calculated as the total spend required to drive 1,000 impressions.
Cost per Click (CPC): measures the efficiency of paid posts driving clicks. It is calculated as the total spend required to drive 1 click.
Cost per Engagement (CPE): measures how much each individual engagement costs.
Results – measures how many actions were taken that match the objectives set.
Results Rate: measures the percentage of results you achieved out of all of the views of your adverts. This is calculated as the number of results divided by impressions.
Cost Per Result (CPR): measures how much it cost to gain a defined result for a campaign – this is calculated as cost divided by results.
Unleash Your Marketing Potential with Digivizer
Harness actionable insights from all your web, social, organic, and paid channels. No complex setups or extravagant costs – just immediate, straightforward clarity.
- 30 days performance insights in under a minute
- Start exploring immediately
- Book a demo or join our events