OWNED MEDIA

Elevate your social presence with owned media analytics

Discover the power of owned media analytics with Digivizer’s real-time insights platform. Maximize your organic social media and website efforts, save time, and prove ROI effortlessly. Dive into a world of streamlined post analytics and rich insights that will shape your marketing strategy.
Get notified of reactions and engage with multiple social profiles across networks, in real-time – from a single dashboard.
Track web metrics against customizable date ranges that work with your business needs.
Compare owned, paid and earned web traffic from one platform to get a complete view of lead generation.

FEATURES & BENEFITS

Unlock actionable insights

Don't miss out on vital insights

Deep dive into comprehensive analysis to see what the best and worst performing posts were across your channels, and by objective.

Make informed decisions

Easily gather and explore detailed post insights and campaign performance data to measure results and showcase your impact.

Maximize hashtag impact

Stay ahead of the curve

With Digivizer, we promise your data remains secure. Our platform is designed for global brands and enterprises, so you can securely share data with anyone in your organization, from your CEO to CFO.

Listen and learn

Uncover critical listening insights that enhance your understanding of your audience and competition.

Optimize video performance

Unlock video potential

Unlock the potential of your videos with multi-channel video analytics. Gain a clear understanding of which video types deliver the most value for your business.

Refine your strategy

Detailed post metrics, from percentage viewed to total time watched, enable you to optimize your best visual content.

Succeed beyond 24 Hours

Make Stories count

Stories may disappear after 24 hours, but their impact should last. Measure likes, tap backs, tap forwards, exits, replies, reach, and more to optimize your Instagram tactics.

Streamline your analytics

Unify your Instagram analysis in one tool to crush your marketing goals and drive more traffic and engagement.

FEATURES & BENEFITS

Measure what matters

Unlock actionable insights

Don’t miss out on vital insights
Deep dive into comprehensive analysis to see what the best and worst performing posts were across your channels, and by objective.
Make informed decisions
Easily gather and explore detailed post insights and campaign performance data to measure results and showcase your impact.

Stay ahead of the curve

Stay ahead of the curve
With Digivizer, we promise your data remains secure. Our platform is designed for global brands and enterprises, so you can securely share data with anyone in your organization, from your CEO to CFO.
Listen and learn
Uncover critical listening insights that enhance your understanding of your audience and competition.

Optimize video performance

Unlock video potential
Stop feeling lost in data and start seeing real results. Digivizer cuts through the noise and shows you what’s driving performance, so you can optimize your marketing and watch those profits soar.
Refine your strategy
Detailed post metrics, from percentage viewed to total time watched, enable you to optimize your best visual content.

Succeed beyond 24 Hours

Make Stories count
Stories may disappear after 24 hours, but their impact should last. Measure likes, tap backs, tap forwards, exits, replies, reach, and more to optimize your Instagram tactics.
Streamline your analytics
Unify your Instagram analysis in one tool to crush your marketing goals and drive more traffic and engagement.

PRICING

Plans for every type of business

All of our plans include 30 days of historical social media, search and web performance data based on what accounts you have connected, all downloaded within a minute. 

Our paid plans include a 30 day free trial.

Pay annually and save 15%

Free

Starter

Teams

Brands

Most popular

Agencies

Enterprise

 
US

$0

 
US

$19

 
US

$89

 
US

$379

 
US

$579

From
US

$579

forever free

/month, billed monthly

/month, billed monthly

/month, billed monthly

/month, billed monthly

/month, billed monthly

For anyone wanting to understand the value of digital marketing insights.

For start-up businesses, small teams and creators wanting to harness real-time insights for growth.

For growing teams focused on building more together.

For companies wanting to engage their entire marketing ecosystem, grow brand health and create strategies for growth.

For agencies wanting to access all digital marketing analytics in one platform and build trust, transparency and growth for each client.

For larger organizations wanting to centralize their global marketing data to improve and speed up decision-making.

Includes:

Includes:

Includes:

Includes:

Includes:

Includes:

Frequently Asked Questions

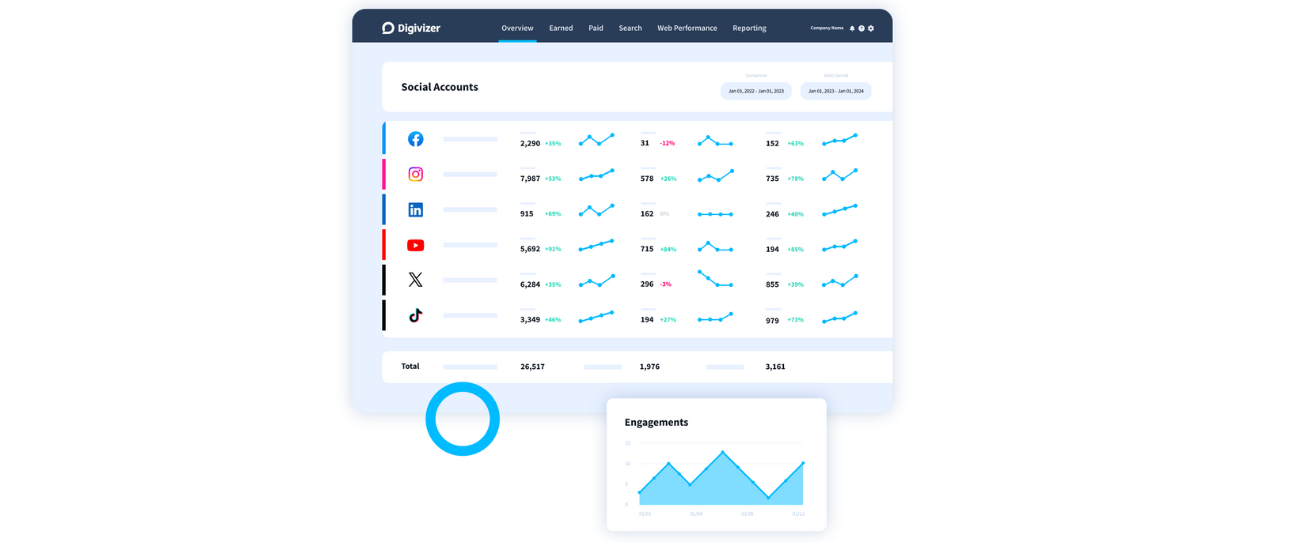
You can get a top-level look at your social media content performance on our Overview. Here you can at a glance start to analyze what is working and what isn’t across organic social and web. Then choose where you wish to dig in deeper.

Social Accounts

The overview page provides an apples-for-apples comparison for your followers, engagements, and video views. As soon as you click through to each platform you will see even richer social media analytics like: Impressions, Reach, Engagement, Click-throughs, Engagement Rates, Comments and you can sort the actual post content to see which creative and messaging is resonating and driving the outcome you are looking for. YouTube provides additional metrics and the ability to sort your content by Average Video Percentage Viewed, Average View Duration, Total Minutes Viewed and more.

Web Performance

See all your most important web performance analytics including your traffic volume, traffic source, search rankings, top pages, revenue, transactions, number of users including number of new users, and other key web performance health metrics. See how organic or paid social is contributing to driving web traffic and delivering conversions and sales, e relative to other sources.
When you first connect your account, including in trial, you will immediately see 30 days of data across your organic, paid and web accounts. Earned Media starts gathering from the time you connect and choose your hashtag to be monitored. Whilst your Digivizer plan is paid up, all your insights will continue to build over time. You can then:

Choose any period you want to measure period on period performance

You can adjust the time period in the date picker in the top right of the Overview Screen and the individual Social Account pages. By default, the date range is set to one week, but you can set it to whichever date range you want to see. You can view the performance of content posted in the last month, or any period of time you have had your account connected (NB: you can only see data from up to 30 days before you connected your accounts to the Digivizer platform for social, search and web, and from the date you select your hashtag to be tracked).

Percentages & period-on-period performance

Everything will measure the exact number of days you currently have selected period on period. If you received more engagements this week than last week, for example, the percentage will be colored green and have an up arrow next to it (eg. 42% more engagements than last week). If you receive fewer engagements, it will be colored red and have a down arrow next to it (eg. 42% fewer engagements than last week).
Know for sure what content is driving conversions and growing your web traffic – where it’s coming from and what’s converting your search terms into sales. In Digivizer you can identify:

– Best performing content on your social channels sorted by key metrics like impressions, video views, engagement, click-throughs, etc for any time period.

– Who posts about your brand, products or services in social and digital channels and which content is driving the highest engagement.

– How every dollar you are investing is working for you.

Grow your share of voice with a digital marketing analytics tool that tracks brand-relevant conversations and industry competitors. With Digivizer you can find out what people say about your business online. Set up social listening to monitor what is being said about your company, brand, products or campaigns on social media channels.

– Add filters to focus the listening data you see by platform, hashtag or brand mention.

– Sort organic and paid posts by engagement rate or by flexible date range.

– Access influencer data for deeper insights and greater collaboration with your ambassadors.

– Respond fast, every time, to build more meaningful relationships with customers and keep an ear to the ground with cross-channel mentions monitoring of your brand and competitor brands. Engage with the customers and top influencers talking about your brand to easily build successful relationships.
With Digivizer you get total visibility over:

– High and low ranking terms to fine-tune your SEO strategy paid keywords. Find the search terms actively driving to your site and monitor their impact, from click to CTR and position.

– Web conversions and ROI with a high level view of trends in revenue, transactions and goal completions. Make detailed comparisons quickly and share with a click.

– Rich insights into your website’s most (and least) viewed pages to understand what content keeps audiences hooked, and where quality traffic exists, so you can optimize from strategy to sales.

You can also use top pages insights to know which pages are working and how to improve web performance and drive quality web traffic to your site or eCommerce store. Web analytics rank each of your web pages based on the average session time, page views, bounce rate, and exit percentage.
With Digivizer’s feature Top Pages, you can understand which pages of your website perform best on web traffic metrics with Digivizer.

What is Top Pages?

In Top Pages, you’ll be able to easily identify which pages of your website perform best on web traffic metrics through a ranking of each of your web pages, the average session time, page views, bounce rate and exit percentage. Users spend on average only 62 seconds viewing a website – that means even if you’re gaining traffic, you still have the challenge of making sure every page of your website is optimized to engage a visitor for as long as possible in order to convert them.

What does Top Pages tell me?

By understanding the pages that are best performing for web traffic, you can easily identify what content, layout, and products resonate with your customers, draw the most traffic, keep visitors engaged and encourage them to further explore your site. Each column highlights a different feature; Page Views (how many people are visiting), Avg. Time on Page (are they staying for long/engagement with content), Bounce Rate (the percentage of single-page sessions in which no interaction was made) and Exit Rate (how often people exit from that page when they visit).

How can I use Top Pages?

As well as identifying your best content, you can measure goals by clicking on any of the metrics outlined above to filter results. You can find the overall average of your page performance in the bottom darker gray bar.
CUSTOMER STORIES
Success speaks volumes

Don’t just take our word for it. Leading brands around the world rely on the Digivizer Advantage.
From small businesses to global companies, our customers come to us for game-changing insights and data-driven support. 

Ready to transform your social media conversations into business success? Sign up for free today and see what your best and worst performing posts are and easily determine what and when to post.